
Evaluating investments might seem straightforward at first, but it unravels itself into complexity. That’s once you get into the details. This is a process that, more often than not, involves a lot of analysis and a long list of financial metrics.
And let’s face it—there are many valuation metrics out there to choose from, and they’re arguably all important in different scenarios. So, how do you discern between them and decide which are best to use?
That’s why Acquinox is here, to help with exactly that—and it’s also why we’re producing this educational series.
In this edition, we’re breaking down two commonly compared metrics: Net Present Value (NPV) and Internal Rate of Return (IRR). They’re two financial heavyweights that investors and analysts use to assess investments. But which one should you use? And how do they differ? Let’s break it down.
Net Present Value vs. Internal Rate of Return
Net Present Value and Internal Rate of Return are both key metrics used in investment decision-making, but they take different routes to get to the bottom line.
Here’s a quick rundown:
- Net Present Value: This calculates the value of future cash flows in today’s dollars. The higher the NPV, the more profitable the investment.
- Internal Rate of Return: This is the discount rate at which the NPV of an investment is zero. It’s the rate that’s required to breakeven on your investment.
So, what’s the key difference?
- NPV tells you an adjusted dollar amount you’re gaining or losing.
- IRR gives you the percentage return required to breakeven on your investment.
Think of NPV as the current value of the entire investment. On the other hand, IRR is the ROI (return on investment) just required to breakeven.
Formulas: Net Present Value vs. Internal Rate of Return?
The math behind these metrics isn’t as intimidating as it looks. Let’s walk through the formulas.
Net Present Value formula:
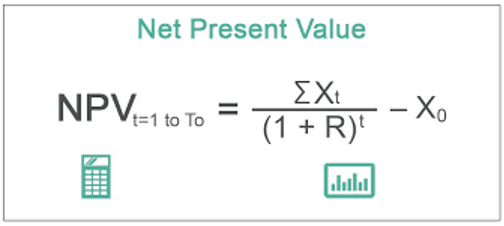
Where:
- R = discount rate
- t = number of the period
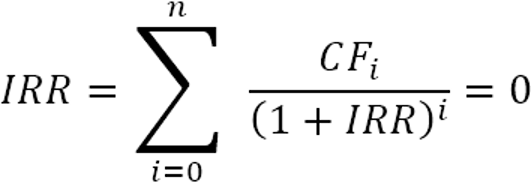
Internal Rate of Return (IRR) formula: The IRR formula is similar to the NPV formula, but instead of solving for NPV, you’re solving for the constant discount rate that makes NPV equal to zero:
Example: Imagine you’re considering investing $10,000 in a project that will bring in $3,000 per year for five years. Let’s assume a discount rate of 5% for NPV calculations.
- For NPV: You’ll calculate the present value (PV) of each year’s cash flow and subtract your initial investment. For example, the PV of the first $3,000 is $2,857. For the second cash flow, its PV is $2,721. Discount and add these up, then subtract the initial $10,000 investment. This gives you a NPV of just below $3,000.
- For IRR: You’ll tweak the discount rate until your NPV equals zero. That rate becomes your IRR. This example gives an IRR of close to 15%.
What Role Do NPV and IRR Play in the World of M&A?
In mergers and acquisitions (M&A), both NPV and IRR play roles in evaluating potential deals. These metrics help companies determine whether an acquisition will create value. They help compare expected returns.
Here’s how they fit in:
- NPV in M&A: When assessing an acquisition, NPV helps determine the price. Is the price justified by the future cash flows the acquired company will generate? A high NPV might signal a great deal.
- IRR in M&A: IRR is used to gauge the attractiveness of a deal by showing the return required to breakeven. It’s especially useful when comparing multiple potential deals side by side.
What These Metrics Show Leadership and Investors
For leadership and investors, NPV and IRR provide valuation insights. By predicting future cash flows, it can help gauge financial health and potential of a business. Then discounting the cash flows helps compare what investments should be worth today. Here’s what these metrics reveal:
NPV:
- Shows whether an investment is likely to create or destroy value.
- Offers a concrete dollar amount, making it easy to assess the impact on the company’s bottom line.
IRR:
- Helps show the efficiency of an investment, expressed as a percentage.
- Helps compare multiple projects by showing rates of return required to break even.
How NPV and IRR Compare in Terms of Usefulness in Valuation?
When it comes to valuation, NPV and IRR have their own strengths and weaknesses.
NPV:
- Strengths: Provides a clear, quantifiable measure of value creation. Easy to interpret in dollar terms.
- Weaknesses: Sensitive to the choice of discount rate. Does not show the magnitude of returns relative to the investment size. That takes additional steps.
IRR:
- Strengths: Gives a percentage return, making it easy to compare against the company’s other investment opportunities.
- Weaknesses: Can be less useful if cash flows alternate a lot between positive and negative. IRR assumes reinvestment at the IRR rate, which may not always be realistic.
How Investors Can Leverage NPV and IRR for a Merger or Acquisition
Investors and acquirers can use both NPV and IRR to make informed decisions during M&A. Here’s how:
NPV:
- Helps determine whether the acquisition will add value to the acquiring company.
- Can guide negotiations by quantifying the impact of various deal terms on value creation.
IRR:
- Allows investors to compare the potential returns of different deals. This helps with choosing the one with the highest projected return.
- Helps ensure that the deal’s expected returns exceed breakeven., ensuring the acquisition is worthwhile.
NPV vs. IRR Key Takeaways
NPV and IRR might seem like just two more numbers in a sea of financial metrics, but they’re far more than that. They’re powerful tools that can help provide a deep understanding of whether an investment is worth pursuing.
Whether you’re involved in a high-stakes acquisition or evaluating a new project, understanding the ins and outs of NPV and IRR can help you make better decisions. Here are key takeaways:
- Net Present Value vs. Internal Rate of Return: NPV shows the dollar value added (or lost) by an investment. On the other hand, IRR shows the percentage return to break even. Both are useful for evaluating investments.
- NPV and IRR in M&A: NPV helps determine if a deal will create value, while IRR shows the annualized return to breakeven. Both are useful for making informed decisions in mergers and acquisitions.
- How Advisors Can Help: M&A can be complex, but having the right guidance makes all the difference. Acquinox has the expertise to help you navigate the numbers. Experts can help ensure you’re making the best decisions for your business.
We hope that you’ve found this article valuable when it comes to learning about NPV vs IRR. If you’re interested in reading more, please subscribe below to get alerted of new articles as we write them.